Plotting methods: cf. matplotlib’s according methods and doc
[1]:
%matplotlib inline
# for figures in notebook

# import & initialize epygram
import epygram
epygram.init_env()

import os
INPUTS_DIR = os.path.join('..', 'inputs')
# [2026/01/28-14:03:35][epygram.formats][<module>:0072][INFO]: Format: HDF5SAF is deactivated at runtime (Error: No module named 'h5py'). Please deactivate from config.implemented_formats or fix error.
# [2026/01/28-14:03:35][falfilfa4py][init_env:0089][WARNING]: ECCODES_DEFINITION_PATH env var is defined: may result in unexpected issues if not consistent with linked eccodes library
[2]:
# open resource in read mode
r = epygram.open(os.path.join(INPUTS_DIR, 'ic.full-surfex.corsica-02km50.fa'), 'r')
[3]:
f = r.readfield('X001TG1')
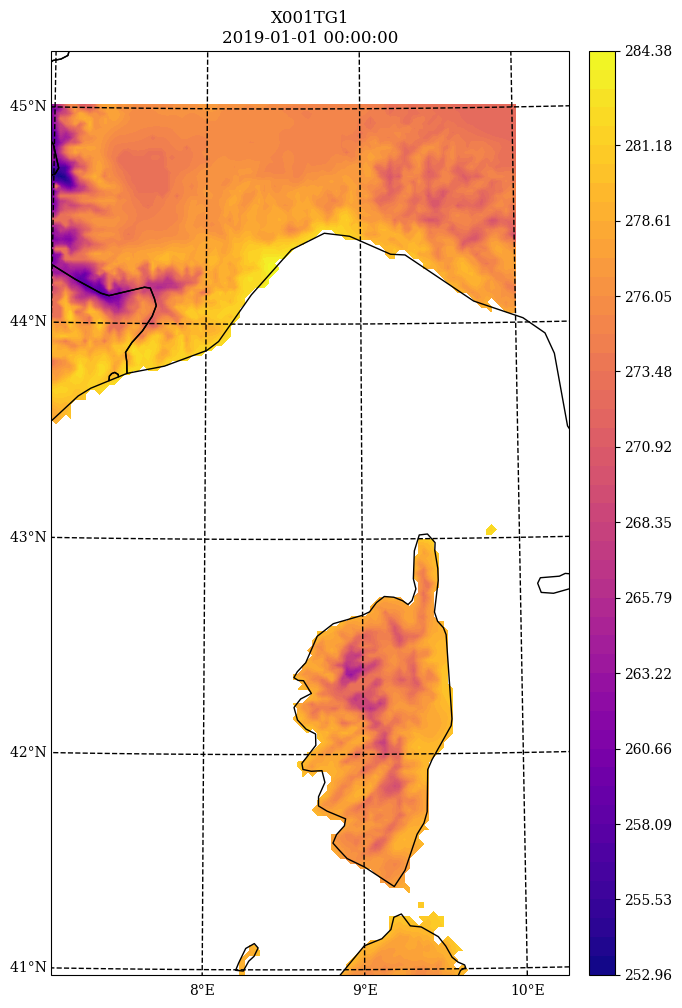
[4]:
fig, ax = f.cartoplot(plot_method='pcolormesh')

[5]:
fig, ax = f.cartoplot(plot_method='contourf')
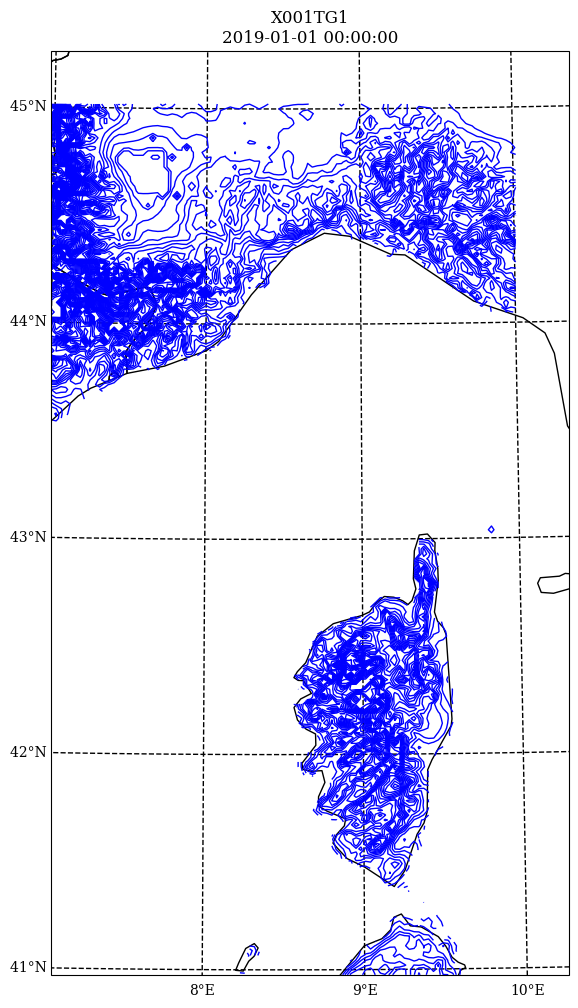
[6]:
fig, ax = f.cartoplot(plot_method='contour')
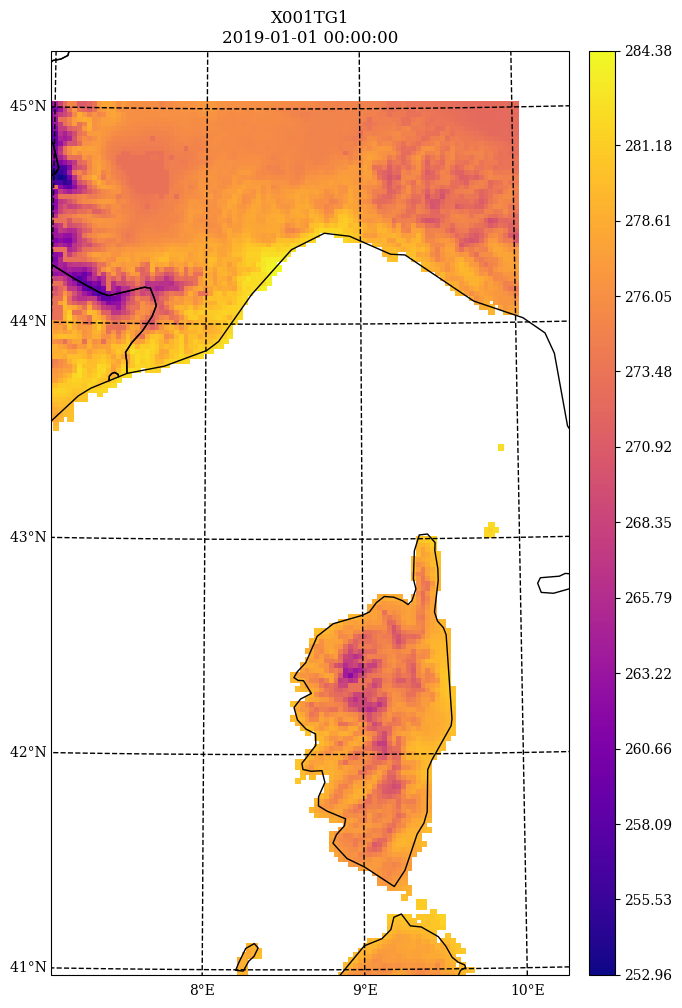
[7]:
fig, ax = f.cartoplot(plot_method='scatter')
/home/mary/venvs/epygram-editable/lib/python3.12/site-packages/matplotlib/cbook.py:1719: UserWarning: Warning: converting a masked element to nan.
  return math.isfinite(val)
[ ]: