Figure with several subplots (a.k.a. axes)
[1]:
%matplotlib inline
# for figures in notebook

# import & initialize epygram
import epygram
epygram.init_env()

import os
INPUTS_DIR = os.path.join('..', 'inputs')
# [2026/01/28-14:03:38][epygram.formats][<module>:0072][INFO]: Format: HDF5SAF is deactivated at runtime (Error: No module named 'h5py'). Please deactivate from config.implemented_formats or fix error.
# [2026/01/28-14:03:38][falfilfa4py][init_env:0089][WARNING]: ECCODES_DEFINITION_PATH env var is defined: may result in unexpected issues if not consistent with linked eccodes library
[2]:
r = epygram.open(os.path.join(INPUTS_DIR, 'ic.full-surfex.corsica-02km50.fa'), 'r')
[3]:
tg = r.readfield('X001TG1')
ts = r.readfield('SFX.SST')
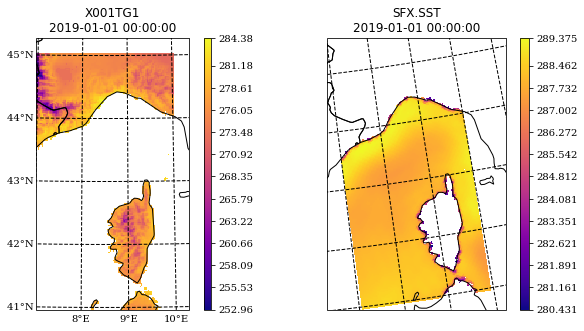
[4]:
from matplotlib.pyplot import figure
fig = figure(figsize=(10,5))
# in this case the projection needs to be specified early on
from cartopy import crs as ccrs
ax1 = fig.add_subplot(1, 2, 1, projection=tg.geometry.default_cartopy_CRS())
ax2 = fig.add_subplot(1, 2, 2, projection=ccrs.NorthPolarStereo())
# then plot
tg.cartoplot(fig=fig, ax=ax1)
ts.cartoplot(fig=fig, ax=ax2)
[4]:
(<Figure size 1000x500 with 4 Axes>,
 <GeoAxes: title={'center': 'SFX.SST\n2019-01-01 00:00:00'}>)
[ ]: