Projection of the plot: satellite view
[1]:
%matplotlib inline
# for figures in notebook

# import & initialize epygram
import epygram
epygram.init_env()

import os
INPUTS_DIR = os.path.join('..', 'inputs')
# [2026/01/28-14:03:42][epygram.formats][<module>:0072][INFO]: Format: HDF5SAF is deactivated at runtime (Error: No module named 'h5py'). Please deactivate from config.implemented_formats or fix error.
# [2026/01/28-14:03:42][falfilfa4py][init_env:0089][WARNING]: ECCODES_DEFINITION_PATH env var is defined: may result in unexpected issues if not consistent with linked eccodes library
[2]:
r = epygram.open(os.path.join(INPUTS_DIR, 'grid.arome-forecast.guyane0025+0012:00.grib'), 'r')
[3]:
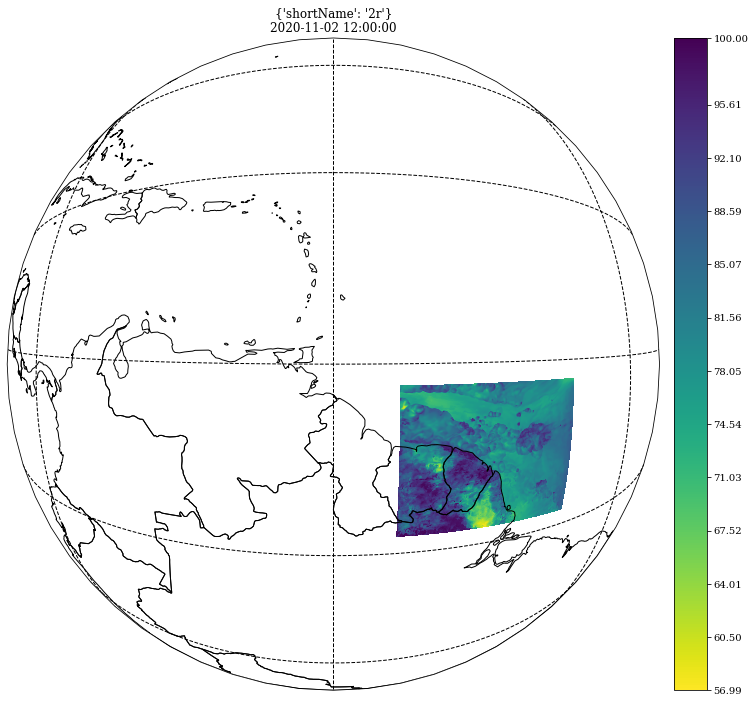
f = r.readfield('shortName:2r')
[4]:
from cartopy.crs import NearsidePerspective
proj = NearsidePerspective(central_longitude=-60.,
                           central_latitude=10.,
                           satellite_height=1e6)
fig, ax = f.cartoplot(projection=proj, extent='global', colormap='viridis_r')
[ ]: