Customize parallels and meridians
[1]:
%matplotlib inline
# for figures in notebook

# import & initialize epygram
import epygram
epygram.init_env()

import os
INPUTS_DIR = os.path.join('..', 'inputs')
# [2026/01/28-14:03:53][epygram.formats][<module>:0072][INFO]: Format: HDF5SAF is deactivated at runtime (Error: No module named 'h5py'). Please deactivate from config.implemented_formats or fix error.
# [2026/01/28-14:03:53][falfilfa4py][init_env:0089][WARNING]: ECCODES_DEFINITION_PATH env var is defined: may result in unexpected issues if not consistent with linked eccodes library
[2]:
r = epygram.open(os.path.join(INPUTS_DIR, 'analysis.full-arpege.tl149-c24.fa'), 'r')
[3]:
f = r.readfield('SURFTEMPERATURE')
[4]:
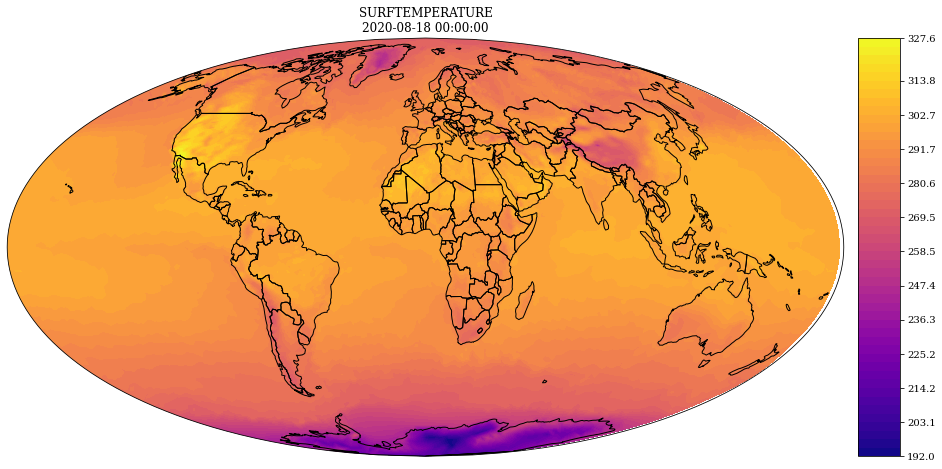
# No grid
fig, ax = f.cartoplot(parallels=None, meridians=None)
[5]:
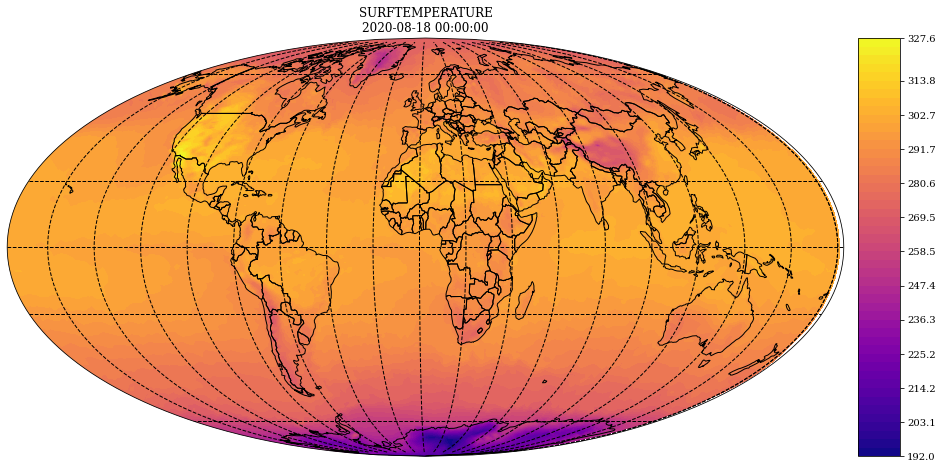
# Customized
fig, ax = f.cartoplot(parallels=[-66.56, -23.44, 0, 23.44, 66.56], meridians=20)
[ ]: