Plotting wind: barbs, wind speed
[1]:
%matplotlib inline
# for figures in notebook

# import & initialize epygram
import epygram
epygram.init_env()

import os
INPUTS_DIR = os.path.join('..', 'inputs')
# [2026/01/28-14:04:36][epygram.formats][<module>:0072][INFO]: Format: HDF5SAF is deactivated at runtime (Error: No module named 'h5py'). Please deactivate from config.implemented_formats or fix error.
# [2026/01/28-14:04:36][falfilfa4py][init_env:0089][WARNING]: ECCODES_DEFINITION_PATH env var is defined: may result in unexpected issues if not consistent with linked eccodes library
[2]:
r = epygram.open(os.path.join(INPUTS_DIR, 'ICMSHAROM+0022'), 'r')
[3]:
u = r.readfield('CLSVENT.ZONAL')
v = r.readfield('CLSVENT.MERIDIEN')
uv = epygram.fields.make_vector_field(u,v)
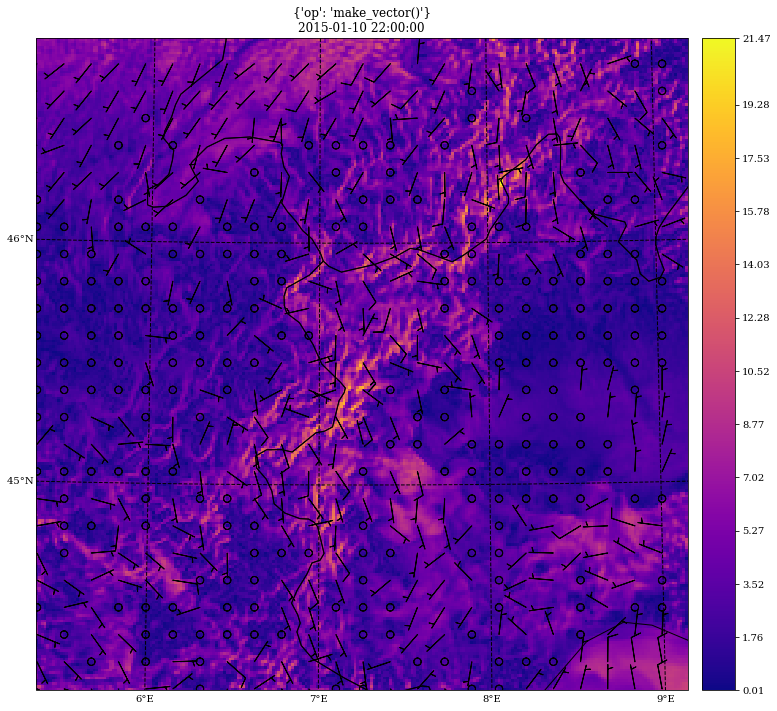
[4]:
fig, ax = uv.cartoplot(subsampling=10, vector_plot_method='barbs', subzone='CI',
                       # ! user got to know the very nature of the field he is plotting:
                       components_are_projected_on='lonlat',
                       map_factor_correction=False)
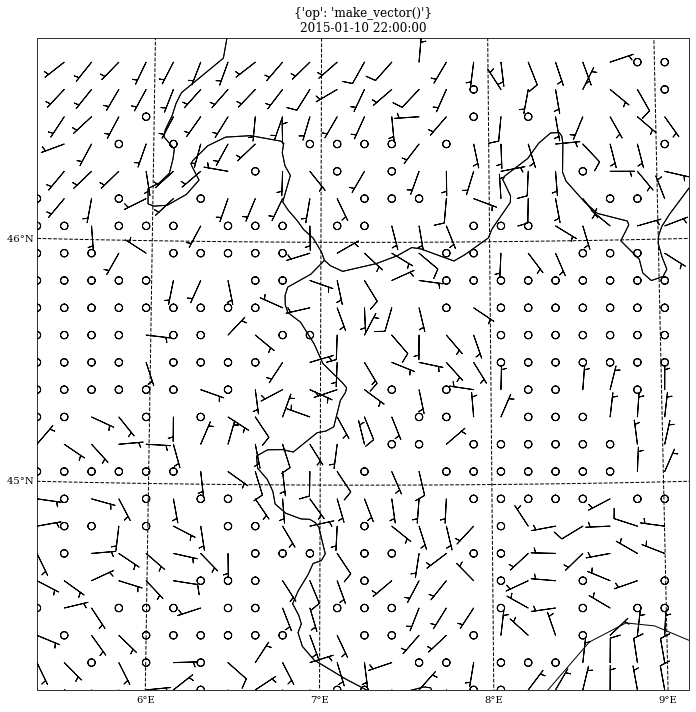
[5]:
# or if you don't want wind speed:
fig, ax = uv.cartoplot(subsampling=10, vector_plot_method='barbs', subzone='CI',
                       # ! user got to know the very nature of the field he is plotting:
                       components_are_projected_on='lonlat',
                       plot_method=None)
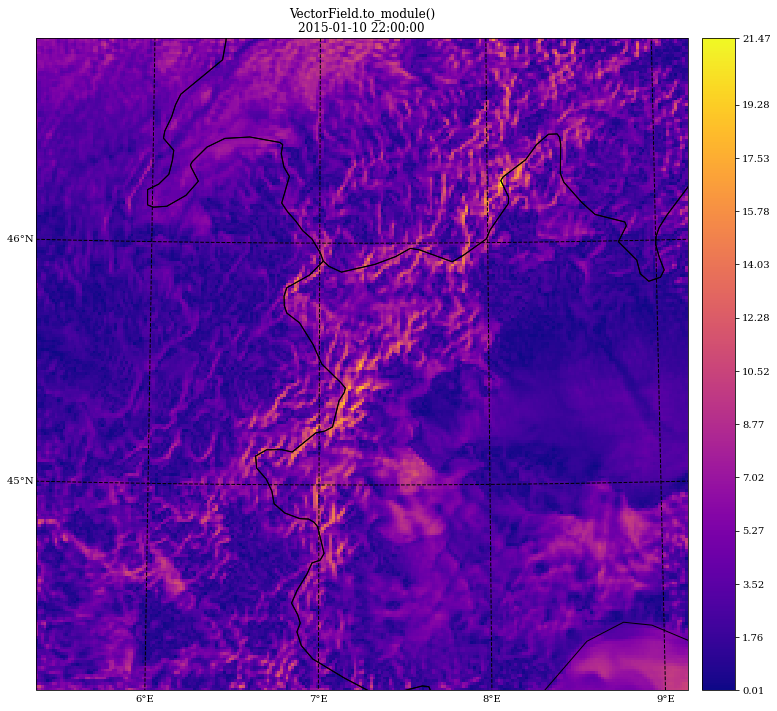
[6]:
# or if you want to plot module only:
ff = uv.to_module()
fig, ax = ff.cartoplot(subzone='CI')
[ ]: