Plot a section
[1]:
%matplotlib inline
# for figures in notebook

# import & initialize epygram
import epygram
epygram.init_env()

# path to file
import os
INPUTS_DIR = os.path.join('..', 'inputs')
# [2026/01/28-14:05:14][epygram.formats][<module>:0072][INFO]: Format: HDF5SAF is deactivated at runtime (Error: No module named 'h5py'). Please deactivate from config.implemented_formats or fix error.
# [2026/01/28-14:05:14][falfilfa4py][init_env:0089][WARNING]: ECCODES_DEFINITION_PATH env var is defined: may result in unexpected issues if not consistent with linked eccodes library
[2]:
r = epygram.resources.meta_resource(os.path.join(INPUTS_DIR, 'ICMSHAROM+0022'),
                                    'r', 'CL')
[3]:
# CL implies GRIB2 nomenclature of fields
f = r.readfield({'discipline':0, 'parameterCategory':0, 'parameterNumber':0,  # temperature
                 'typeOfFirstFixedSurface':119})  # on model levels
f.sp2gp()
ecTrans at version: 1.6.0
commit: 2c4c818d79effe56d30bb2896866aba590a5fad8
[4]:
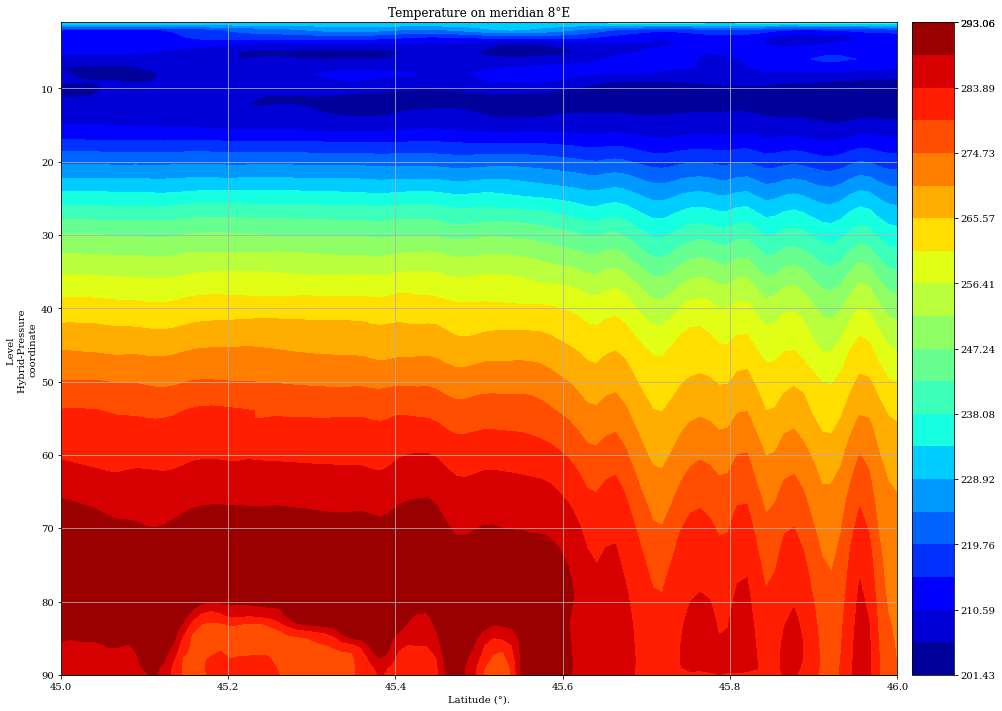
s = f.extractsection((8,45), (8,46), interpolation='linear')
[5]:
fig, ax = s.plotfield(title='Temperature on meridian 8°E', x_is='lat')
[ ]: