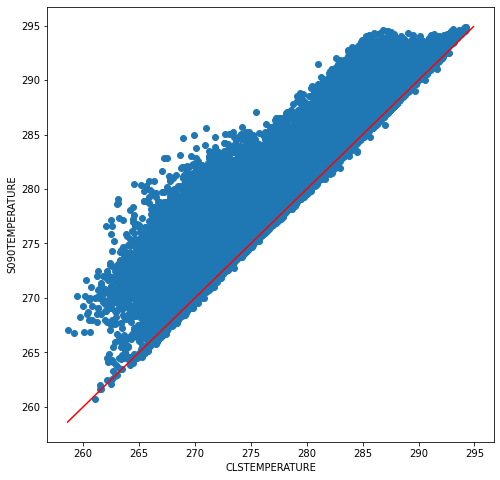
Comparison of 2 fields through a scatter-plot
[1]:
%matplotlib inline
# for figures in notebook

# import & initialize epygram
import epygram
epygram.init_env()

import os
INPUTS_DIR = os.path.join('..', 'inputs')
# [2026/01/28-14:05:30][epygram.formats][<module>:0072][INFO]: Format: HDF5SAF is deactivated at runtime (Error: No module named 'h5py'). Please deactivate from config.implemented_formats or fix error.
# [2026/01/28-14:05:30][falfilfa4py][init_env:0089][WARNING]: ECCODES_DEFINITION_PATH env var is defined: may result in unexpected issues if not consistent with linked eccodes library
[2]:
# open resource in read mode
r = epygram.open(os.path.join(INPUTS_DIR, 'ICMSHAROM+0022'), 'r')
[3]:
t90 = r.readfield('S090TEMPERATURE')
t90.sp2gp()
t2m = r.readfield('CLSTEMPERATURE')
ecTrans at version: 1.6.0
commit: 2c4c818d79effe56d30bb2896866aba590a5fad8
[4]:
fig, ax = t2m.scatter_with(t90, figsize=(8,8), subzone='CI', fidkey='FA')
[ ]: