Apply a mask using another field
in this case, use the land-sea mask field to mask non-land values
[1]:
%matplotlib inline
# for figures in notebook

# import & initialize epygram
import epygram
epygram.init_env()

import os
INPUTS_DIR = os.path.join('..', 'inputs')
# [2025/01/16-17:42:14][epygram.formats][<module>:0072][INFO]: Format: HDF5SAF is deactivated at runtime (Error: No module named 'h5py'). Please deactivate from config.implemented_formats or fix error.
[2]:
r = epygram.open(os.path.join(INPUTS_DIR, 'ICMSHAROM+0022'), 'r')
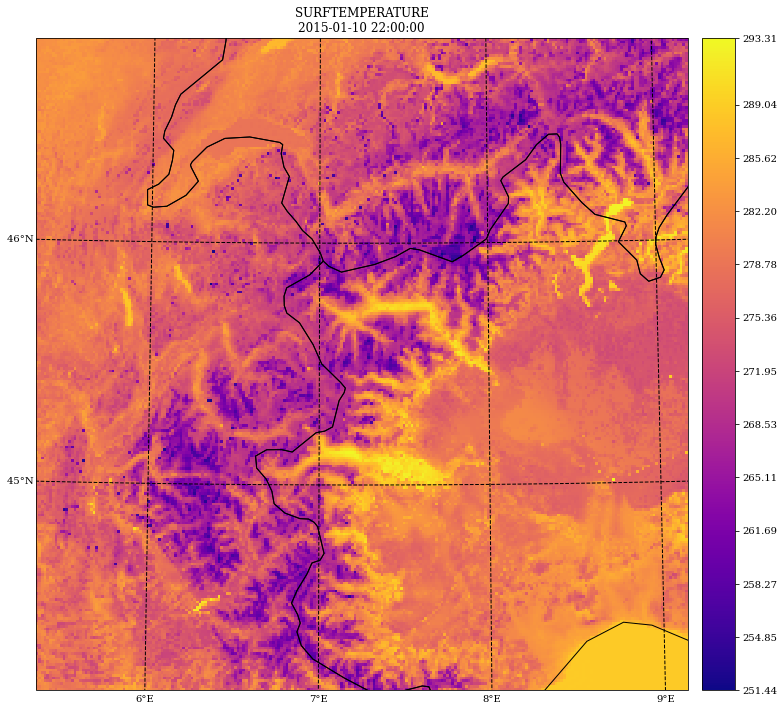
[3]:
f = r.readfield('SURFTEMPERATURE')
[4]:
fig, ax = f.cartoplot(subzone='CI')
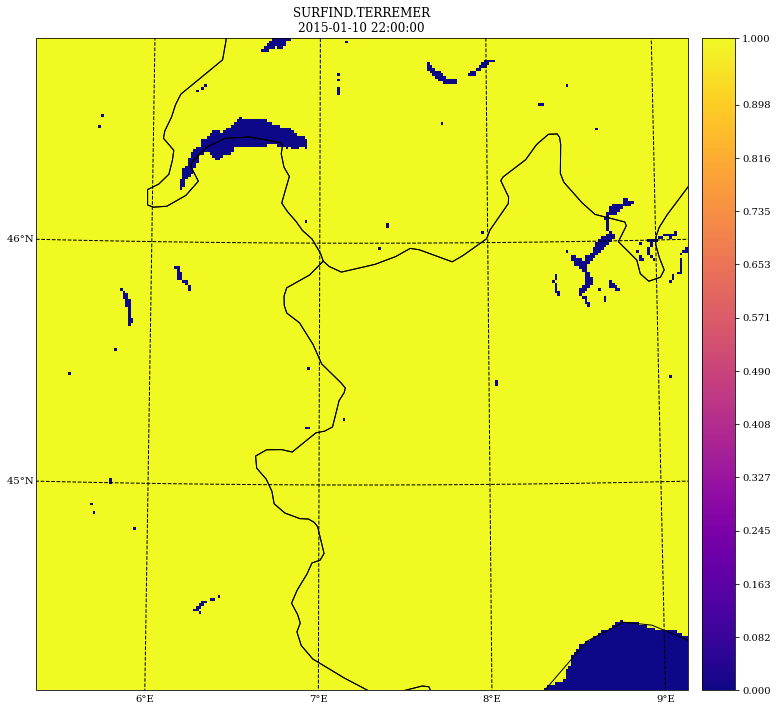
[5]:
lsm = r.readfield('SURFIND.TERREMER')
[6]:
fig, ax = lsm.cartoplot(subzone='CI')
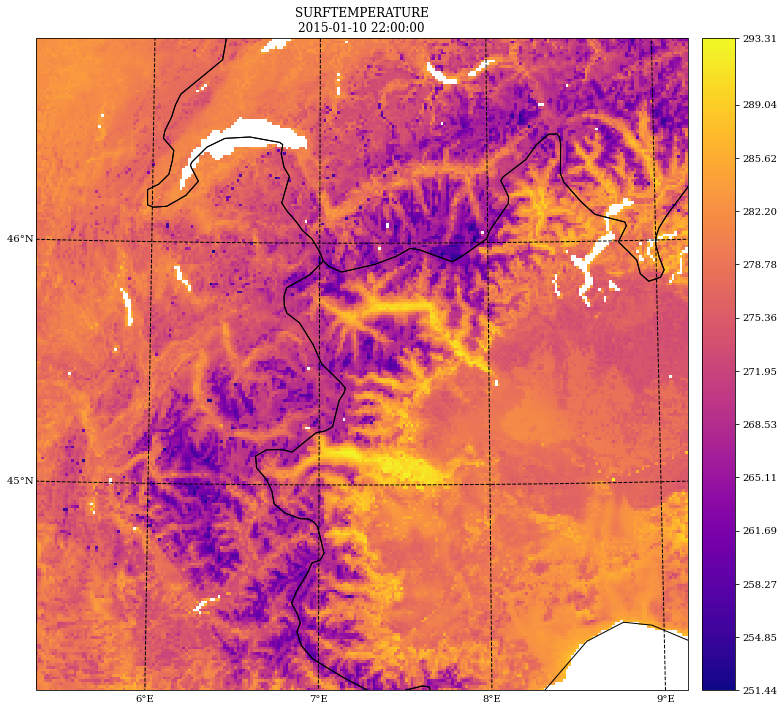
[7]:
import numpy
masked_data = numpy.ma.masked_where(lsm.getdata() < 0.5, f.getdata())
f.setdata(masked_data)
[8]:
f.cartoplot(subzone='CI')
[8]:
(<Figure size 1600x1200 with 2 Axes>,
 <GeoAxes: title={'center': 'SURFTEMPERATURE\n2015-01-10 22:00:00'}>)
[ ]: