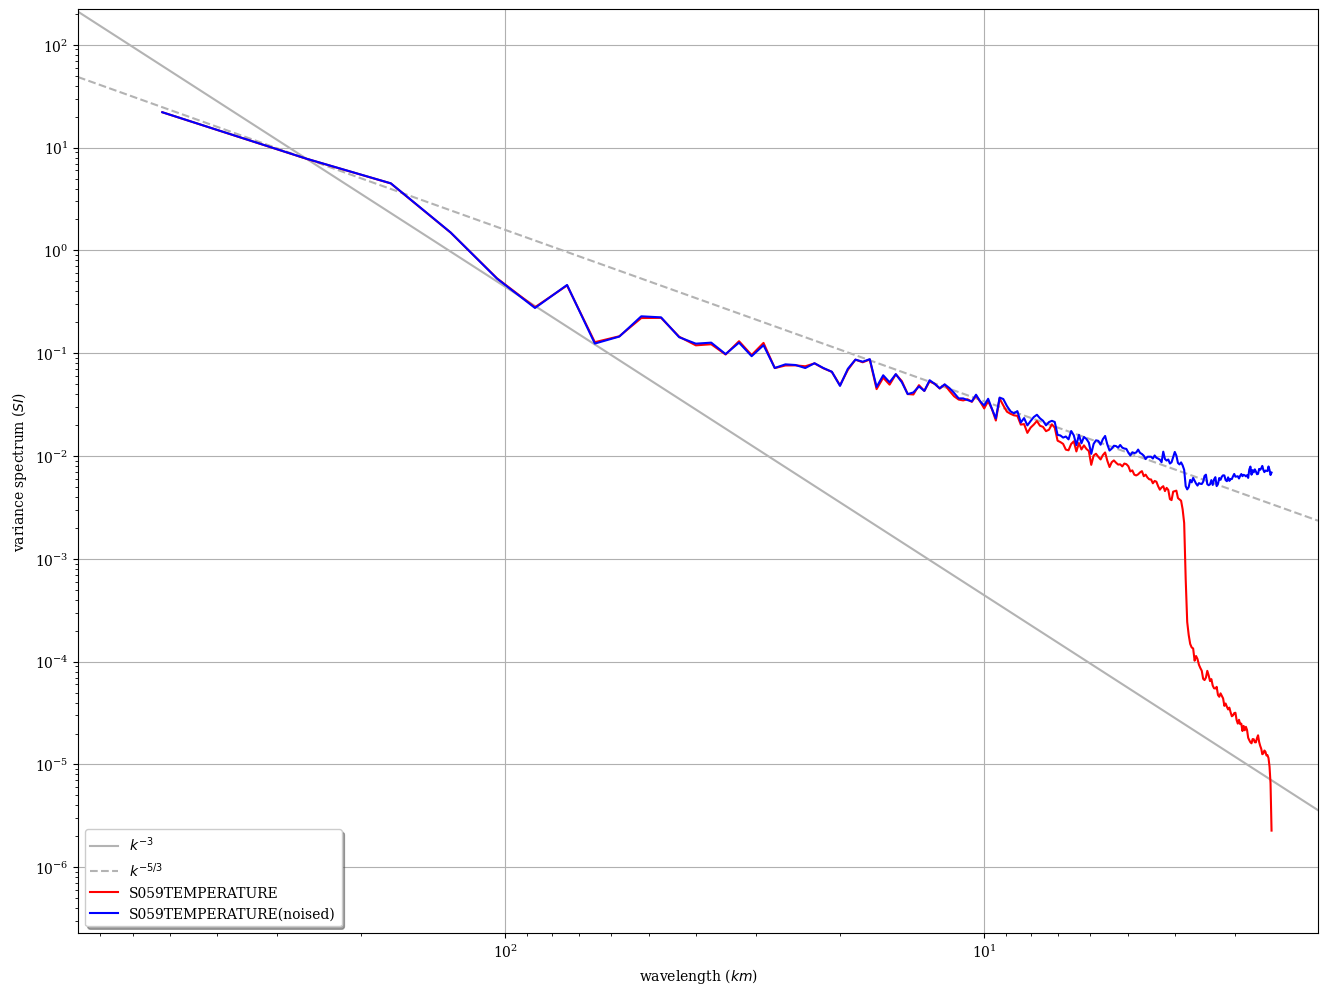
Modify field data, by adding a white noise to it
and visualization of differences as (DCT) variance spectrum plot
[1]:
%matplotlib inline
# for figures in notebook

# import & initialize epygram
import epygram
epygram.init_env()

import os
INPUTS_DIR = os.path.join('..', 'inputs')
# [2026/01/28-14:08:37][epygram.formats][<module>:0072][INFO]: Format: HDF5SAF is deactivated at runtime (Error: No module named 'h5py'). Please deactivate from config.implemented_formats or fix error.
# [2026/01/28-14:08:37][falfilfa4py][init_env:0089][WARNING]: ECCODES_DEFINITION_PATH env var is defined: may result in unexpected issues if not consistent with linked eccodes library
[2]:
r = epygram.open(os.path.join(INPUTS_DIR, 'ICMSHAROM+0022'), 'r')
t59 = r.readfield('S059TEMPERATURE')
t59.sp2gp()
ecTrans at version: 1.6.0
commit: 2c4c818d79effe56d30bb2896866aba590a5fad8
[3]:
# initial field
sp59 = t59.dctspectrum()
sp59.name = t59.fid['FA']
[4]:
# add a white noise
import numpy
field_data = t59.getdata()
noise = numpy.random.normal(0, size=field_data.shape)
t59.setdata(field_data + noise)
# and compute DCT spectrum
sp59n = t59.dctspectrum()
sp59n.name = sp59.name + '(noised)'
[5]:
# and plot
fig, ax = epygram.spectra.plotspectra([sp59, sp59n])
[ ]: