Plot the z/p characteristics of a Hybrid-Pressure vertical coordinate
(cf. python package pyvgrid from PyPI and its command-line tool mkvgrid to build new vertical coordinates)
[1]:
# import & initialize epygram
import epygram
epygram.init_env()

import os
INPUTS_DIR = os.path.join('..', 'inputs')
# [2026/01/28-14:10:47][epygram.formats][<module>:0072][INFO]: Format: HDF5SAF is deactivated at runtime (Error: No module named 'h5py'). Please deactivate from config.implemented_formats or fix error.
# [2026/01/28-14:10:47][falfilfa4py][init_env:0089][WARNING]: ECCODES_DEFINITION_PATH env var is defined: may result in unexpected issues if not consistent with linked eccodes library
[2]:
# open resource in read mode
r = epygram.open(os.path.join(INPUTS_DIR, 'ICMSHAROM+0022'), 'r')
hybridP_geo = r.readfield('S058TEMPERATURE').geometry.vcoordinate
ecTrans at version: 1.6.0
commit: 2c4c818d79effe56d30bb2896866aba590a5fad8
[3]:
vmean = "LAPRXPK=False" # or 'geometric' or 'arithmetic'
[4]:
vg = r.geometry.vcoordinate.to_vgrid(vertical_mean=vmean,
                                     vgrid_name=r.container.basename)
[5]:
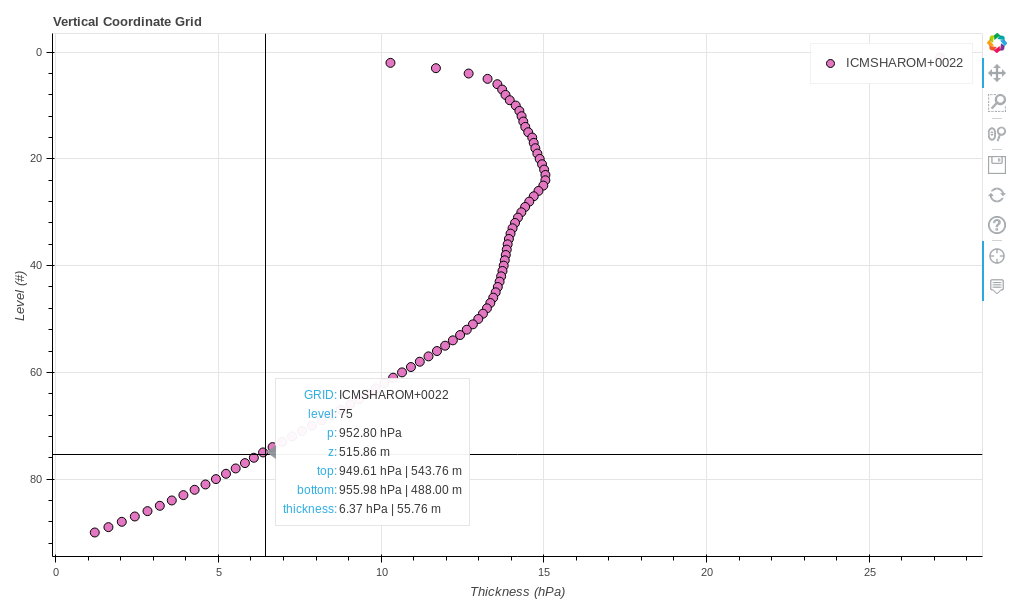
# y and x may be among ('z', 'p', 'level', 'pthickness', 'zthickness')
fig = vg.bokeh_plot_y_vs_x('level', 'pthickness')
[6]:
# Save and open html output file:
# vg.bokeh_fig_to_html(fig)

# which will look like:
[7]:
print(vg.write_AB_to_namelist())
# [2026/01/28-14:11:04][pyvgrid.hybridpressurevgrid][write_AB_to_namelist:0282][INFO]: A/B coefficients written to namelist file: ICMSHAROM+0022.NAMVV1
ICMSHAROM+0022.NAMVV1
[ ]: