Persistence for model assessment#
Persistence model (simulations are equal to the observations of the day
before) may be of interest for model assessment.
From an Observations
object you can built an Evaluator
object corresponding to model persistence with
persistence_model
method.
In [1]: import evaltools as evt

In [2]: from datetime import date, timedelta

In [3]: stations = evt.utils.read_listing("./sample_data/listing")

In [4]: start_date = date(2017, 6, 1)

In [5]: end_date = date(2017, 6, 4)

In [6]: observations = evt.Observations.from_time_series(
   ...:     generic_file_path="./sample_data/observations/{year}_no2_{station}",
   ...:     correc_unit=1e9,
   ...:     species='no2',
   ...:     start=start_date,
   ...:     end=end_date,
   ...:     stations=stations,
   ...:     forecast_horizon=2)
   ...:

In [7]: persistence = observations.persistence_model()
Important
Remember that the starting day of the new object persistence is the day after the starting day of observations.
In [8]: persistence.summary()
Model: persistence
Species: no2
Time step: 1 hour
Period: 20170602 - 20170604
Forecast horizon: 2
Color: k
Then, to define other Evaluator
objects on a period corresponding to the period
of persistence, you can for instance use
sub_period method.
In [9]: observations = observations.sub_period(start_date+timedelta(days=1), end_date)

In [10]: simulations = evt.Simulations.from_time_series(
   ....:     generic_file_path=(
   ....:         "./sample_data/MFMforecast/J{forecastDay}/{year}_no2_{station}"
   ....:     ),
   ....:     stations_idx=stations.index,
   ....:     species='no2',
   ....:     model='MFM',
   ....:     start=start_date+timedelta(days=1),
   ....:     end=end_date,
   ....:     forecast_horizon=2)
   ....:

In [11]: eval_object = evt.Evaluator(
   ....:     observations, simulations, color=['#00FFFF'],
   ....: )
   ....:
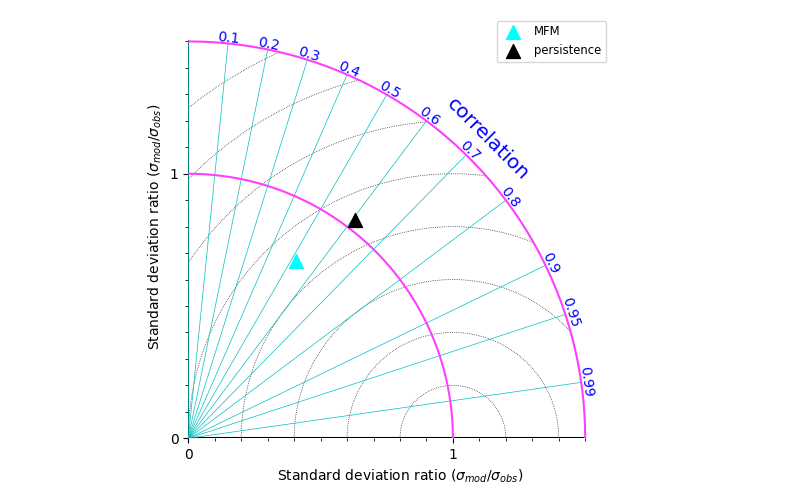
And you can now draw the persistence performances on any chart.
In [12]: evt.plotting.plot_taylor_diagram([eval_object, persistence],
   ....:     output_file="./source/charts/taylor_with_persistence")
   ....:
Out[12]:
(<Figure size 800x500 with 1 Axes>,
 <Axes: xlabel='Standard deviation ratio ($\\sigma_{mod} / \\sigma_{obs}$)', ylabel='Standard deviation ratio ($\\sigma_{mod} / \\sigma_{obs}$)'>)