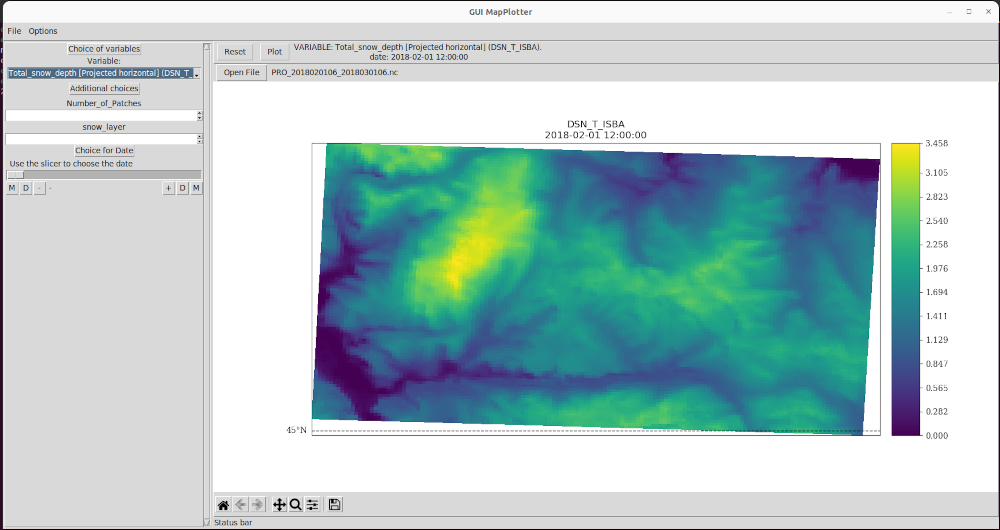
Launching the mapplotter script without any argument (or with only a filename) opens a GUI that alow browsing the content of a PRO file (browsing across variables, dates and potential other dimensions such as tiles, layers if needed).
usage: mapplotter.py [-h] [-f FIELD] [--wU UCOMPONENTOFWIND]
                     [--wV VCOMPONENTOFWIND] --date DATE [-d REFNAME]
                     [-x OPERATION] [--mt MASK_THRESHOLD]
                     [--wpo {lonlat,grid}] [--mpf]
                     [--pm {pcolormesh,contourf,contour,scatter}] [-m MINMAX]
                     [-n LEVELSNUMBER] [-c COLORMAP] [-t] [--title TITLE]
                     [--cpyf CARTOPY_FEATURES] [--depts]
                     [--parallels PARALLELS] [--meridians MERIDIANS]
                     [-s VECTORS_SUBSAMPLING] [--skw SCATTER_KW] [--zoom ZOOM]
                     [--vpm VECTOR_PLOT_METHOD] [--qk QUIVERKEY]
                     [--fd FIGURES_DPI]
                     [--global_shift_center GLOBAL_SHIFT_CENTER]
                     [-C DIFFCOLORMAP] [-T] [-O OUTPUTFILENAME] [-v]
                     filename

An EPyGrAM based tool for simple plots of meteorological or snow cover related
2D fields from a resource file.

positional arguments:
  filename              name of the file to be processed.

options:
  -h, --help            show this help message and exit
  -f FIELD, -F FIELD, --field FIELD
                        *fid* = *field identifier* of of the field(s) to be
                        processed. Syntax depends on format: GRIB: handgrip,
                        e.g. 'shortName:t,level:850'. FA: name, e.g.
                        'S050TEMPERATURE'; regular expressions may be used,
                        such as 'S00[2-6]WIND.[U-V].PHYS', 'SURFALBEDO*' or
                        'SURF?.OF.OZONE'. To obtain the list of fields in
                        file, use the 'epy_what' tool.
  --wU UCOMPONENTOFWIND, --Ucomponentofwind UCOMPONENTOFWIND
                        to process wind as a vector. U component of wind.
                        (same syntax as -f). Not implemented in difference
                        mode.
  --wV VCOMPONENTOFWIND, --Vcomponentofwind VCOMPONENTOFWIND
                        to process wind as a vector. V component of wind.
                        (same syntax as -f). Not implemented in difference
                        mode.
  --date DATE           Selected date in a bronx.Date compatible string format
  -d REFNAME, --diff REFNAME
                        name of the 2nd (reference) file to be processed, to
                        which comparison is done.
  -x OPERATION, --operation OPERATION
                        do the requested operation on field right after
                        reading it. Syntax: '-,273.15' (e.g. for K => C) or
                        'exp' to take the exponential of the field. The
                        operand must be among (+,-,*,/) or 'normalize' or any
                        numpy function. For '-' operand, use short-name option
                        -x without spacetab between option and argument.
  --mt MASK_THRESHOLD, --mask_threshold MASK_THRESHOLD
                        set a threshold to mask values. E.g. 'min=0.0' will
                        mask negative values. 'min=0.0,max=1e8' will mask
                        values outside these boundaries.
  --wpo {lonlat,grid}, --wind_projected_on {lonlat,grid}
                        specify on which coordinates the wind components are
                        projected.
  --mpf, --map_factor_correction
                        apply a map factor correction to wind.
  --pm {pcolormesh,contourf,contour,scatter}, --plot_method {pcolormesh,contourf,contour,scatter}
                        plot method, among ('pcolormesh', 'contourf',
                        'contour', 'scatter'). Default is 'pcolormesh' for
                        rectangular grids, else 'contourf'. There is a known
                        bug (yet unsolved) with Arpege & contourlines.
  -m MINMAX, --minmax MINMAX
                        min and max values for the plot. Syntax: 'min, max'.
                        '0.0, max' also works. Default is the field min/max
                        values. In diff mode, this is valuable for resource
                        and reference only, (min, max) for difference plot
                        should be defined with --diffminmax option. For
                        negative values, use short-name option -m without
                        spacetab between option and argument.
  -n LEVELSNUMBER, --levelsnumber LEVELSNUMBER
                        number of levels for contours and shades. Default is
                        50.
  -c COLORMAP, --colormap COLORMAP
                        name of the **matplotlib** colormap to use. Default is
                        'jet' (Cf. http://matplotlib.org/examples/color/colorm
                        aps_reference.html for standard matplotlib colormaps,
                        or epygram.config.epygram_colormaps.keys() in a python
                        interpreter for epygram's own colormaps). Custom
                        colormaps can be defined (lookup matplotlib online or
                        manually) and added in userconfig, in usercolormaps =
                        {'my_cmap':'path_to_my_cmap'}.
  -t, --center_cmap_on_0
                        to center the colormap on the value 0. Can be useful
                        for wind plots for instance.
  --title TITLE         title to be written over field plot.
  --cpyf CARTOPY_FEATURES, --cartopy_features CARTOPY_FEATURES
                        cartopy features (cartopy.feature.*), separated by
                        comma ['BORDERS', 'COASTLINE', 'COLORS', 'LAKES',
                        'LAND', 'OCEAN', 'RIVERS', 'STATES']
  --depts               draw french departments on map (instead of countries
                        boundaries).
  --parallels PARALLELS
                        tune the choice of lines to plot, among: 'auto':
                        automatic scaling to the map extents (default) |
                        'default': range(0,360,10) and range(-90,90,10) | a
                        list of values | a grid step, e.g. 5 to plot each 5
                        degree | None: no one is plot
  --meridians MERIDIANS
                        Same as parallels, cf. parallels doc.
  -s VECTORS_SUBSAMPLING, --vectors_subsampling VECTORS_SUBSAMPLING
                        Subsampling factor for plotting vectors barbs (-w:
                        computewind option). Defaults to 20.
  --skw SCATTER_KW, --scatter_kw SCATTER_KW
                        arguments to be passed to pyplot.scatter(), in case
                        *plot_method* == 'scatter'.
  --zoom ZOOM           optional zoom on the specified region of the plot.
                        Forces to 'cyl' projection. Syntax: 'lonmin=-5,
                        lonmax=1.2, latmin=40.8, latmax=51'. Overwrites
                        'projection' option.
  --vpm VECTOR_PLOT_METHOD, --vector_plot_method VECTOR_PLOT_METHOD
                        symbol to be used for vectors, among ('quiver',
                        'barbs', 'streamplot').
  --qk QUIVERKEY, --quiverkey QUIVERKEY
                        arguments to be passed to pyplot.quiverkey(), in case
                        *vector_symbol* == 'arrows'. E.g.
                        X=1.05,Y=1.05,U=10.,label='10m/s'.
  --fd FIGURES_DPI, --figures_dpi FIGURES_DPI
                        quality of saved figures.
  --global_shift_center GLOBAL_SHIFT_CENTER, --gsc GLOBAL_SHIFT_CENTER
                        for global lon/lat grids, shift the center by the
                        requested angle (in degrees). Enables a [0,360] grid
                        to be shifted to a [-180,180] grid, for instance (with
                        -180 argument).
  -C DIFFCOLORMAP, --diffcolormap DIFFCOLORMAP
                        name of the **matplotlib** colormap to use for diff.
                        Default is 'RdBu_r' (Cf. http://matplotlib.org/example
                        s/color/colormaps_reference.html for standard
                        matplotlib colormaps, or
                        epygram.config.epygram_colormaps.keys() in a python
                        interpreter for epygram's own colormaps). Custom
                        colormaps can be defined (http://colormap.org or
                        manually) and added in userconfig, in usercolormaps =
                        {'my_cmap':'path_to_my_cmap'}.
  -T, --diffcenter_cmap_on_0
                        NOT to center the colormap of diff plots on the value
                        0. May be useful for fluxes decumulation.
  -O OUTPUTFILENAME, --outputfilename OUTPUTFILENAME
                        store output in the specified filename (without format
                        for graphical output, to be completed by -o/--output).
  -v, --verbose         run verbosely. Else, only messages of level Error will
                        be displayed.

End of help for: mapplotter.py (EPyGrAM v2.0.4)
refname – name of the reference file to be compared to.
diffmode – if True, plots the difference field between the field in filename and refname.
date – date and time to choose from the file
Pre-processing:
Parameters:
operation – makes the requested operation
(e.g. {‘operation’:’-‘,’operand’:273.15} or
{‘operation’:’exp’}) on the field before plot.
global_shift_center – for global lon/lat grids, shift the center by the
requested angle (in degrees). Enables a [0,360] grid
to be shifted to a [-180,180] grid, for instance (with -180 argument).
zoom – a dict(lonmin, lonmax, latmin, latmax) on which to build the plot.
Figure:
Parameters:
title – title to be written over plot.
Graphical settings:
Parameters:
plot_method – matplotlib plotting method to be used, among
(‘pcolormesh’, ‘contourf’, ‘contour’, ‘scatter’).
minmax – tuple giving (or not) min and max fields values to be plotted.
colorsnumber – number of color discretization/isolines for fields plots.
colormap – name of the colormap for fields plots.
center_cmap_on_0 – to center the colormap on 0.
mask_threshold – dict with min and/or max value(s) to mask outside.
scatter_kw – kwargs to be passed to matplotlib’s ax.scatter().
Only for plot_method = ‘scatter’.
Cartography:
Parameters:
parallels (meridians and) – enable to fine-tune the choice of lines to
plot, with either:
- ‘auto’: automatic scaling to the map extents
- ‘default’: range(0,360,10) and range(-90,90,10)
- a list of values
- a grid step, e.g. 5 to plot each 5 degree.
- None: no one is plot
french_depts – draws french departments instead of countries boundaries.
cartopy_features – list of cartopy.feature.??? features.
Vector plots:
Parameters:
vectors_subsampling – subsampling ratio of vectors plots.
vector_plot_method – among (‘quiver’, ‘barbs’, ‘streamplot’) for vector plots.
wind_components_are_projected_on – inform the plot on which axes the
vector components are projected on (‘grid’ or ‘lonlat’).
If None (default), look for information in the field, or raise error.
quiverkey – options to be passed to plotfield to activate a quiver key
(cf. pyplot.quiverkey).
map_factor_correction – if True, applies a correction of magnitude
to vector due to map factor.
Output:
Parameters:
savefig – save figures to file, instead of interactive plot
outputfilename – specify an output filename for the plot,
including format as extension.
 python snowtools/plots/maps/mapplotter.py -f DSN_T_ISBA --date 20150301T06 --diff <testbasedir>/PRO/PRO_first_2014080106_2015080106.nc <testbasedir>/PRO/PRO_second_2014080106_2015080106.nc -O 20150301T06_snowheight_diff.png
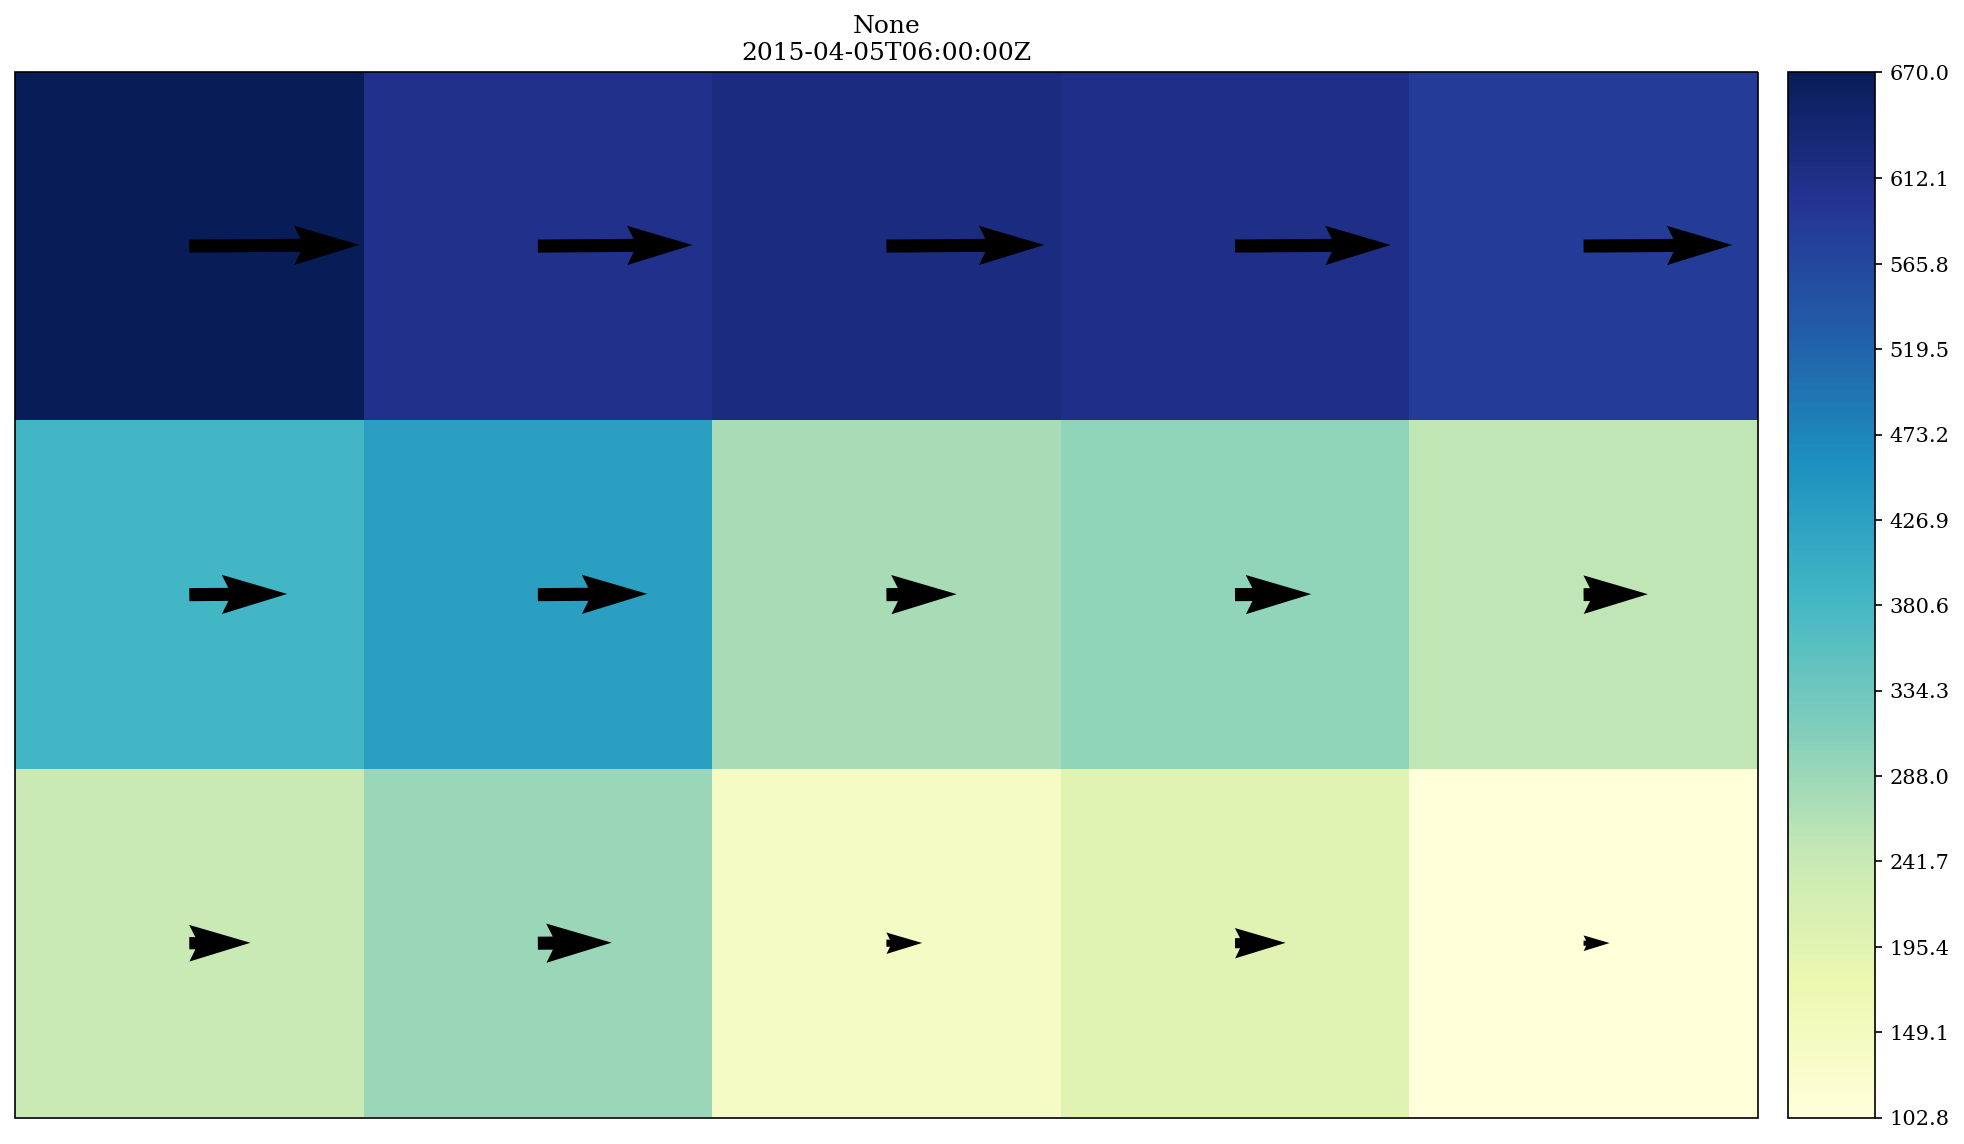
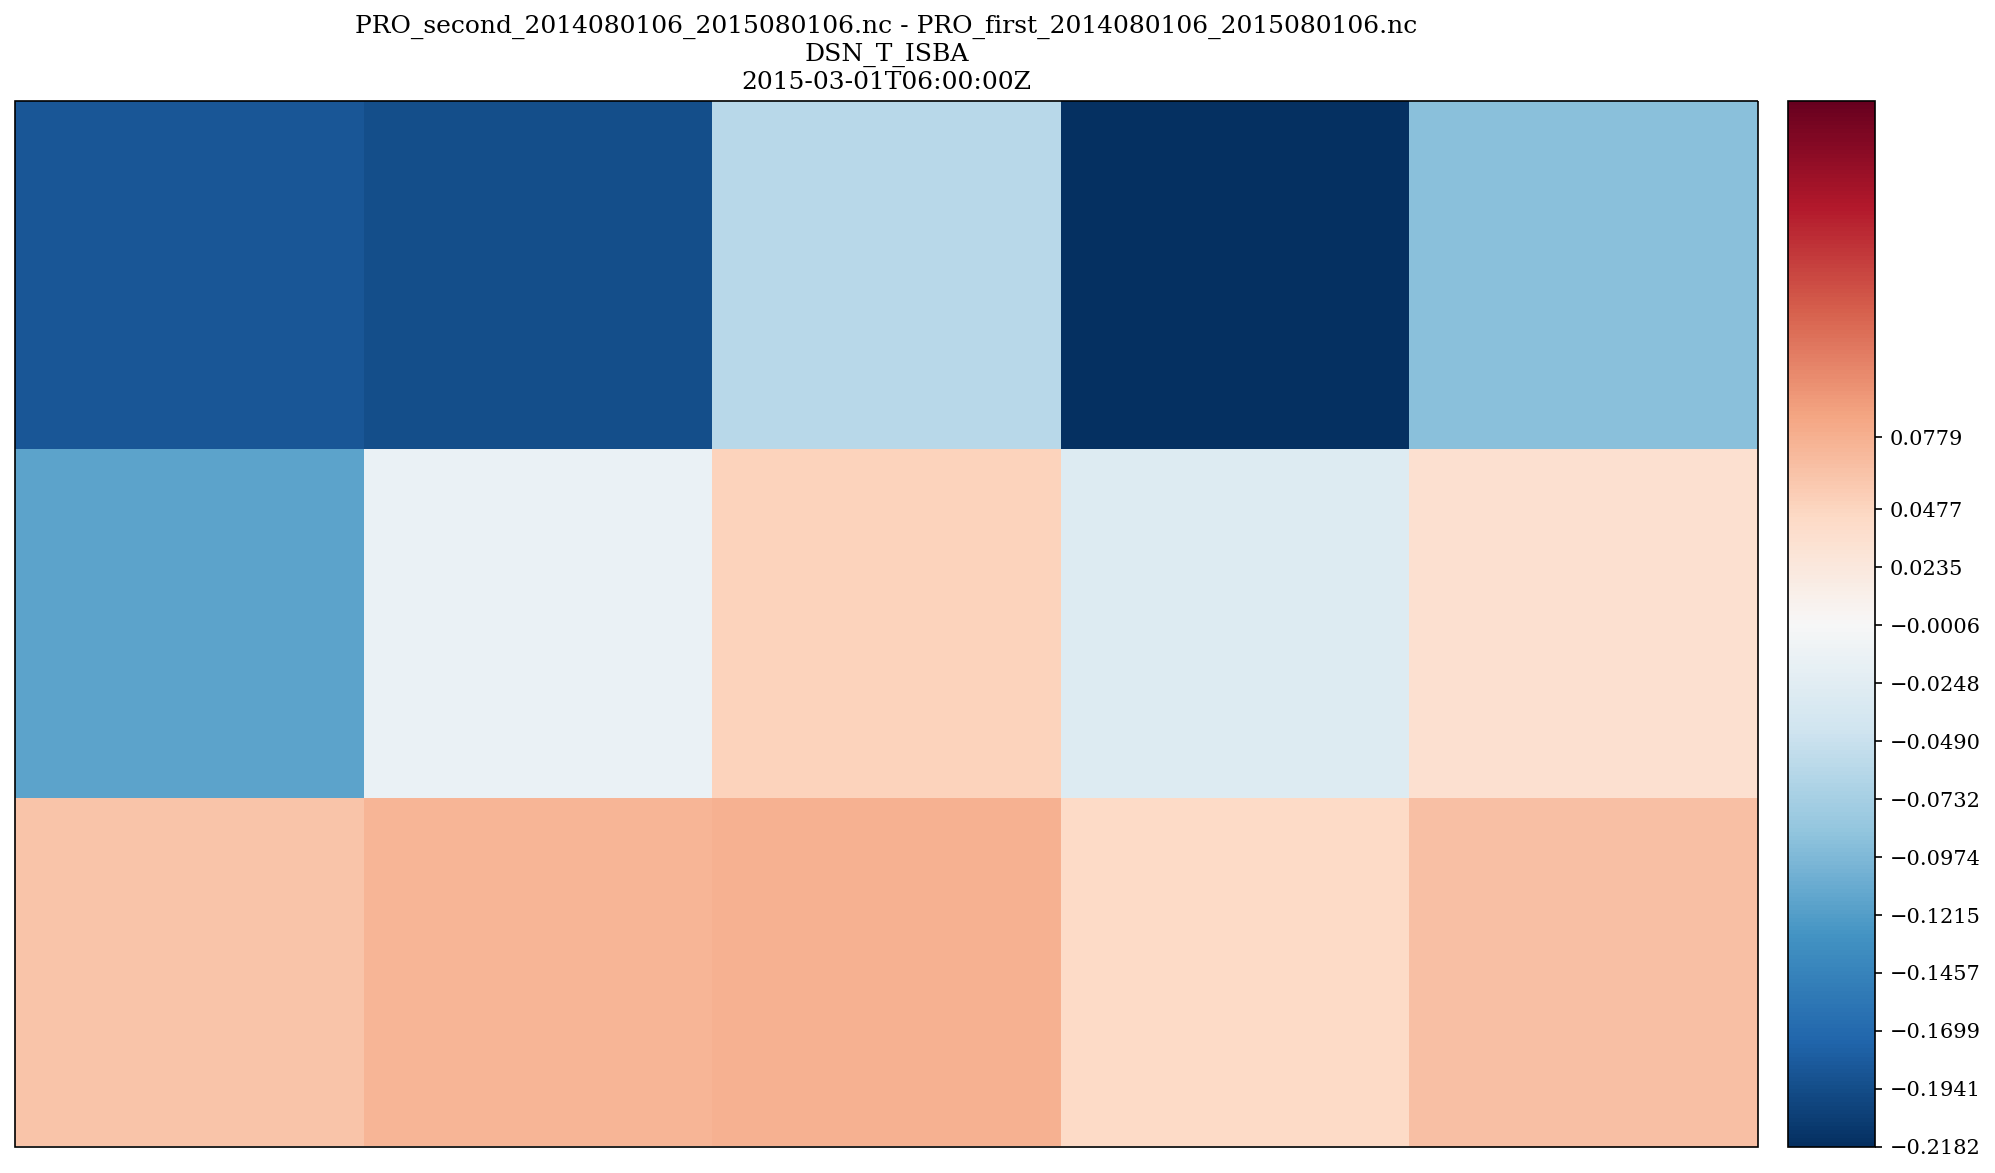 python snowtools/plots/maps/mapplotter.py --wU WSN_T_ISBA --wV SNOMLT_ISBA --date 20150405T06 --wpo grid --vectors_subsampling 1 <testbasedir>/PRO/PRO_first_2014080106_2015080106.nc -O 20150405T06_pseudo_wind_map.png