Temporal plots
Deterministic plots
Base temporal plots are in the module plots/temporal/chrono.
Created on 4 déc. 2018
This script contains classes allowing to make matplotlib graphs with an automatic formatting of the temporal axis in order to adapt to simulation temporal extent.
@author: lafaysse
- class plots.temporal.chrono.prettyensemble(*args, **kwargs)[source]
Bases:
temporalplotConstructor for temporalplot_abstract class, redefinied for the child class
- class plots.temporal.chrono.spaghettis(*args, **kwargs)[source]
Bases:
temporalplotConstructor for temporalplot_abstract class, redefinied for the child class
- class plots.temporal.chrono.spaghettis_with_det(*args, **kwargs)[source]
Bases:
spaghettisConstructor for temporalplot_abstract class, redefinied for the child class
- class plots.temporal.chrono.temporalplot(*args, **kwargs)[source]
Bases:
temporalplot_abstractClass for timeseries plot
Constructor for temporalplot_abstract class, redefinied for the child class
- class plots.temporal.chrono.temporalplot2Axes(*args, **kwargs)[source]
Bases:
temporalplotKept for bakward compatibility LM2B = Looks Broken to Me
Constructor for temporalplot_abstract class, redefinied for the child class
- class plots.temporal.chrono.temporalplotObsMultipleSims(*args, **kwargs)[source]
Bases:
temporalplotKept for bakward compatibility , please refer to temporalplotObsSim Similar to temporalplotObsSim but UGLIER
Constructor for temporalplot_abstract class, redefinied for the child class
- draw(timeObs, varObs, timeSim, varSim, *args, **kwargs)[source]
Method of temporalplotObsMultipleSims class. Used for generating comparative 1D plot with time formatting. Similar to temporalplotObsSim but UGLIER
- Parameters:
timeObs – Array of Observation duration usually given by prosimu.readtime()
varObs – Array of Observation data usially given by prosimu.read()
timeSim – Array of simulation duration usually given by prosimu.readtime()
varSim – Array of simulation data usially given by prosimu.read()
args – (optional)
kwargs – optional ( matplotlib.pyplot key arguments )
- Returns:
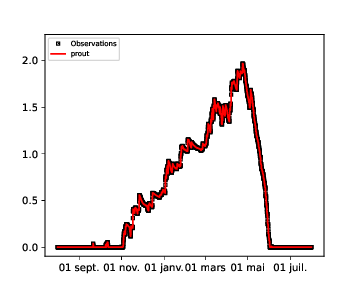
- class plots.temporal.chrono.temporalplotObsSim(*args, **kwargs)[source]
Bases:
temporalplotClass for 1D variable temporal plot comparaison with observation
Example :
from snowtools.utils.prosimu import prosimu
from snowtools.plots.temporal.chrono import temporalplotObsSim
# read data
with prosimu('/rd/cenfic3/cenmod/home/viallonl/testbase/PRO/PRO_LaPlagne_2000-2001.nc') as p:
    sd = p.read('DSN_T_ISBA')
    sd2 = p.read('SNOWTEMP')
    time = p.readtime()
plot = temporalplotObsSim()
plot.draw(time, sd,time,sd,label='prout') # comparaison of sd with sd during the same time
plot.finalize(time) # pour gérer les dates correctement
plot.save('EX-temporalplotObsSim.png')
Constructor for temporalplot_abstract class, redefinied for the child class
- draw(timeObs, varObs, timeSim, varSim, *args, **kwargs)[source]
Method of temporalplotObsSim class. Used for generating comparative 1D plot with time formatting.
- Parameters:
timeObs – Array of Observation duration usually given by prosimu.readtime()
varObs – Array of Observation data usially given by prosimu.read()
timeSim – Array of simulation duration usually given by prosimu.readtime()
varSim – Array of simulation data usially given by prosimu.read()
args – (optional)
kwargs – optional ( matplotlib.pyplot key arguments )
- Returns:
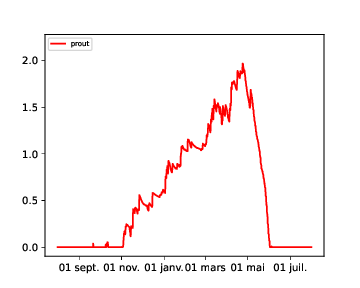
- class plots.temporal.chrono.temporalplotSim(*args, **kwargs)[source]
Bases:
temporalplotClass for 1D variable temporal plot
Example :
from snowtools.utils.prosimu import prosimu
from snowtools.plots.temporal.chrono import temporalplotSim

# read data
with prosimu('/rd/cenfic3/cenmod/home/viallonl/testbase/PRO/PRO_LaPlagne_2000-2001.nc') as p:
    sd = p.read('DSN_T_ISBA')
    sd2 = p.read('SNOWTEMP')
    time = p.readtime()
plot = temporalplotSim()
plot.draw(time, sd,label='prout')
plot.finalize(time) # pour gérer les dates correctement
plot.save('EX-temporalplotSim.png')
Constructor for temporalplot_abstract class, redefinied for the child class
- draw(timeSim, varSim, *args, **kwargs)[source]
Method of temporalplotSim class. Used for generating a 1D plot with time formatting.
- Parameters:
timeSim – Array of simulation duration usually given by prosimu.readtime()
varSim – Array of simulation data usially given by prosimu.read()
args – (optional)
kwargs – optional ( matplotlib.pyplot key arguments )
- Returns:
Ensemble plots
Ensemble plots are in the module plots/temporal/escroc_plot.
Created on 4 déc. 2018
@author: lafaysse
Comparison tool
To compare two simulations, a script is available in plots/temporal/compare_sims.py.
Script plots/temporal/compare_sims.py help:
Usage: compare_sims.py [-b YYYYMMDD] [-e YYYYMMDD] --dirsim=dirsim1,dirsim2 --labels=label1,labe2 --dirplot=dirplot --format=pdf,png,eps --yearly

Options:
  -h, --help            show this help message and exit
  -b DATEBEGIN, --begin=DATEBEGIN
                        First year of extraction
  -e DATEEND, --end=DATEEND
                        Last year of extraction
  --pro=PRO             List of pro files to compare
  --labels=LABELS       Labels of simulations in the plot
  --var=VAR             Name of variable to plot
  --dirplot=DIRPLOT     Directory where the figures are saved
  --format=FORMAT       Format of plots
  --yearly              Yearly plots
Demo files
A demo file is available in plots/temporal/demo.py. A file for plots for COMOD is also is in plots/temporal/impact_comod.py.